When an AI feature feels slow, switching to a smaller model is only one possible fix. The delay may come from a queue, retrieval, a large prompt, a slow first token, long output, sequential tool calls, validation or a buffering proxy. Measure each stage before changing the model so you can target the part that actually costs time.
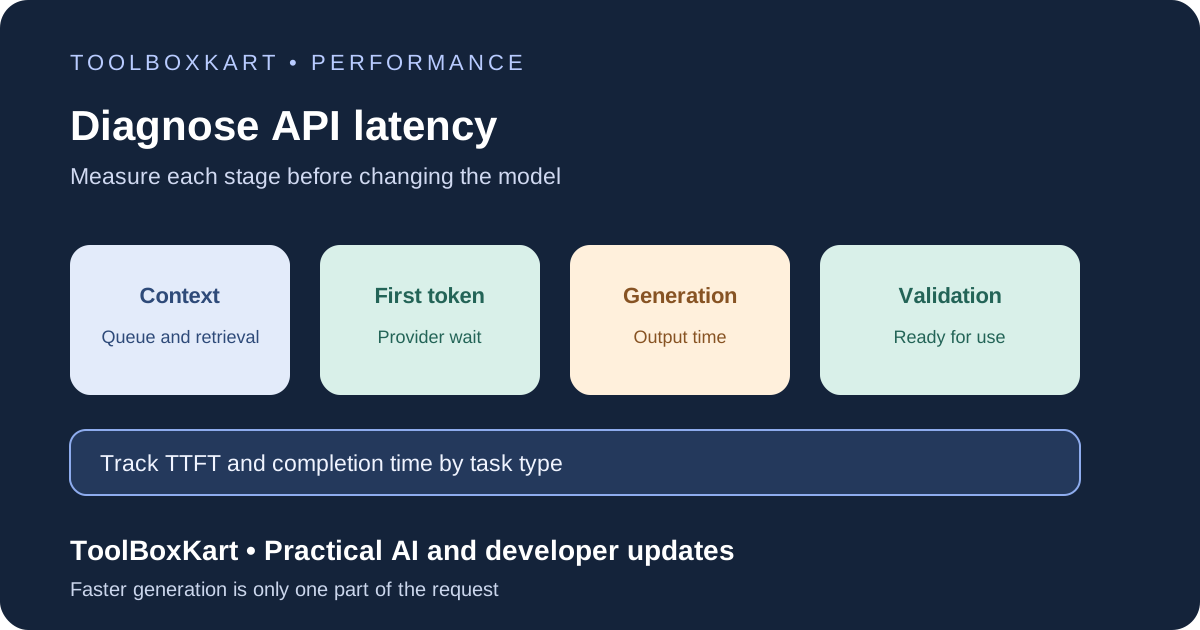
Measure the full request, not just model time
Start with the user’s end-to-end wait: from submitting a request to receiving a usable result. Then split it into stages that match your architecture.
| Stage | What to measure | What a delay may indicate |
|---|---|---|
| Queue and admission | Time waiting for a worker or concurrency slot | Overloaded workers or rate limits |
| Context preparation | Prompt construction, retrieval and reranking | Slow search, too much context or expensive preprocessing |
| Provider wait | Time from request start to first event | Network setup, provider queueing or a large input |
| Generation | Time from first output to final event | Long output or slow token generation |
| Post-processing | Validation, moderation, storage and rendering | Local code or infrastructure bottlenecks |
Not every application needs every stage. Record the milestones that let you distinguish local application time from provider time and output generation time.
Track time to first token and completion separately
For a streamed interface, time to first token (TTFT) measures when the user first sees output. Time to completion measures when the full response is ready. A change can improve one without improving the other. Streaming may reduce perceived waiting while total generation time stays about the same. A shorter answer may improve completion time but not help if the application spends most of its time retrieving documents before the model call.
Record both metrics along with response length and request outcome. If the first token is fast but completion is slow, inspect output length and generation speed. If the first token is slow, inspect queueing, prompt size, retrieval, connection setup and provider response time. If the model finishes quickly but the user still waits, inspect validation, moderation, storage and proxy buffering.
Use percentiles and group requests by task
An average can hide the requests that frustrate users. Track p50 and p95 latency, and p99 when traffic volume supports it. Break the data down by workflow, model, provider, region, streaming mode, prompt-size range and output-size range. Compare like with like: a short classification request should not be mixed with a long report-generation task when deciding whether a change helped.
Record a request ID, model identifier, input and output token counts, cache indicators, retry count and final status. Avoid logging raw prompts by default if they can contain personal or confidential data. Use a trace ID to join server-side stages without copying sensitive content into every log line.
Add timestamps at real event boundaries
In a Node.js backend, a monotonic timer such as performance.now() can measure elapsed durations. Record a timestamp when context preparation finishes, when the provider request starts, when the first streamed event arrives, when the provider signals completion and when post-processing finishes. Calculate the duration between those marks rather than relying on wall-clock timestamps that may change if the system clock is adjusted.
For failed requests, record which stage failed and whether the first token arrived. Do not record a fake zero for generation time when the provider never responded. Use traces or histograms to aggregate results instead of treating one request as representative.
Fix the bottleneck you measured
If queueing dominates, limit concurrency, apply backpressure or add worker capacity. If retrieval dominates, check index latency, query complexity, document count and reranking. If TTFT is high, inspect prompt size, provider response time and whether the request can start earlier. If generation dominates, reduce unnecessary output, consider a faster model for that task and test whether quality stays acceptable.
If several model calls happen one after another, see whether independent steps can run in parallel or whether some deterministic work can be handled without a model. OpenAI’s latency optimization guide covers faster token processing, fewer input and output tokens, fewer requests, parallel work, streaming and using non-LLM methods where suitable.
Do not optimize by removing validation or review steps just to lower a latency number. A faster response that returns malformed data or an incorrect result is a regression. Measure task success and quality alongside speed.
Run controlled tests before rollout
Choose a representative set of tasks and replay them with the same prompt, source data and expected output. Change one variable at a time: model, output limit, retrieval settings, prompt structure, streaming or concurrency. Compare p50 and p95 TTFT and total latency, plus task success, validation failures, token use and cost per successful task.
Keep separate measurements for retries and failed requests. A retry can make the final task succeed while increasing total wait and spend. A fallback model may improve availability but change answer quality. Our model evaluation workflow explains how to compare quality, latency and cost before changing providers.
Frequently asked questions
Does a smaller model always make an AI feature faster?
No. Retrieval, queueing, network time, sequential calls and post-processing can dominate the request.
What is the difference between TTFT and total latency?
TTFT is the time until the first visible output arrives. Total latency is the time until the task is complete and the result is ready for use.
Which latency metrics should I report?
For user-facing features, report TTFT and end-to-end completion time, with p50 and p95 values grouped by comparable task type.